Captain D’s
Background
Tango has worked with Captain D’s since 2020—and have helped the leading QSR extract insight out of their existing restaurant portfolio and using that information to build predictive models to identify high potential developments, best next locations, and how to size territories.
From its founding in 1969, Captain D’s has been a staple in the quick-service restaurant (QSR) industry, traditionally operating large restaurants with extensive seating. However, shifting consumer preferences and rising operational costs led to a strategic transformation. In collaboration with Tango, Captain D’s has embraced data-driven decision-making to refine its site selection, optimize store formats, and drive smarter expansion strategies.


Challenges
Prior to working with Tango, Captain D’s faced several challenges:
Selecting the right markets. Identifying markets that best fit Captain D’s target demographics and competition landscape.
Understanding customer travel patterns. The brand assumed customers were willing to travel long distances, but data suggested otherwise.
Predicting market impact. Determining the impact of new store openings on existing locations, particularly in avoiding self-cannibalization.
Optimizing new store formats. Balancing customer demand for convenience with the need to actively manage real estate and operational costs.

The Solution
Strategic Shifts & Data-Driven Insights
To address these challenges, Captain D’s leveraged Tango’s advanced analytics and location intelligence solutions.
Adapting Store Formats to Consumer Preferences
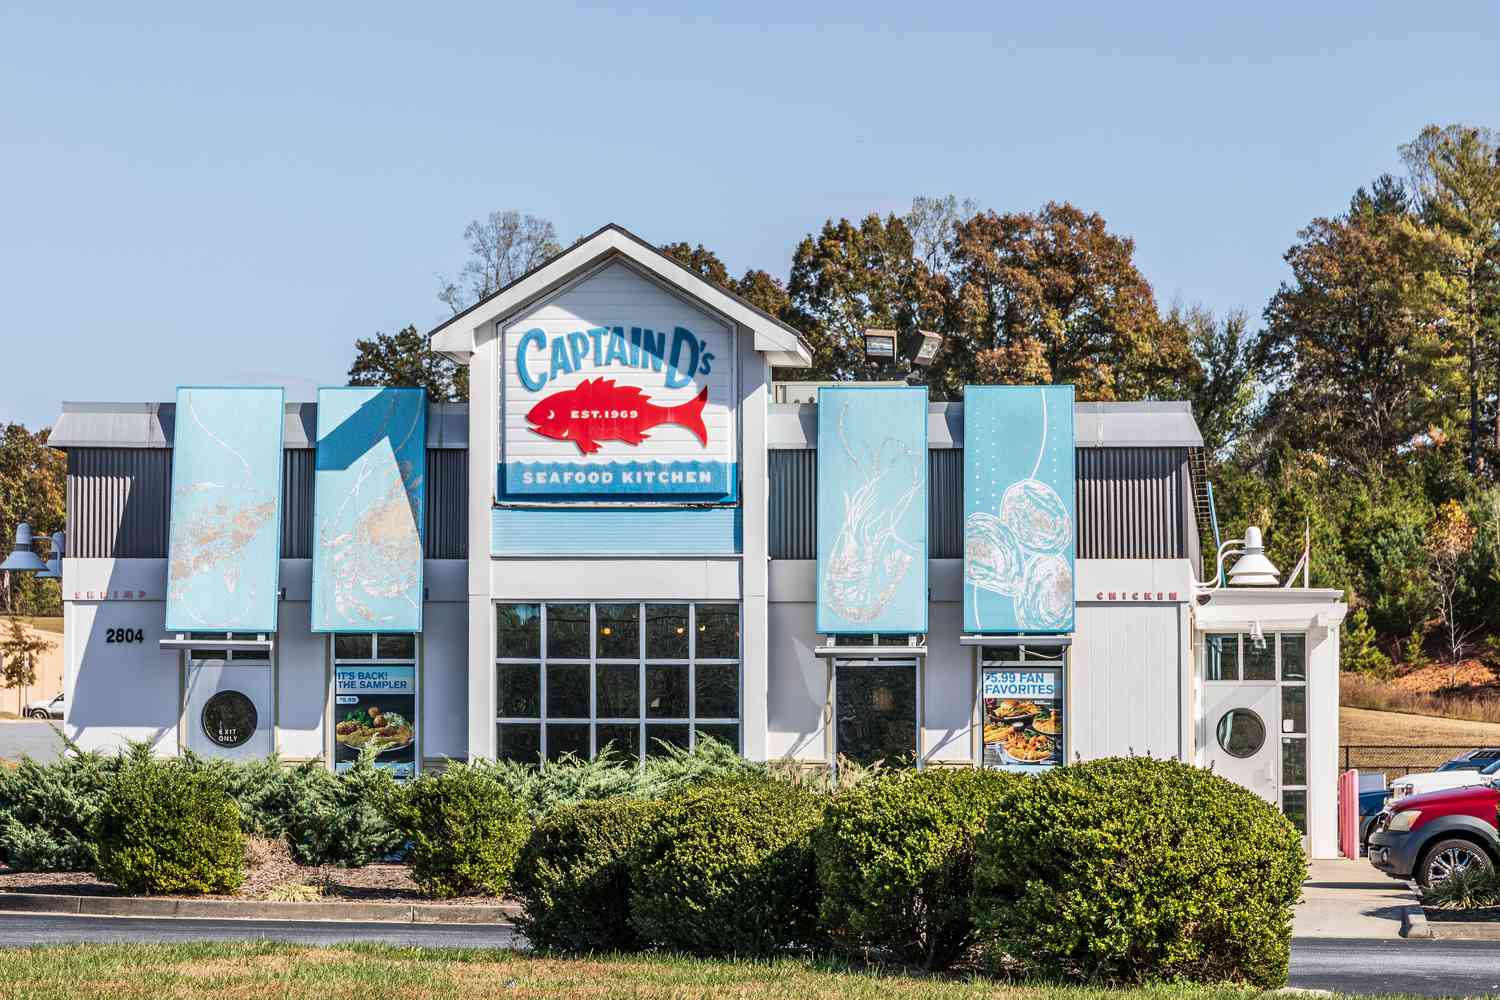
Historically, Captain D’s restaurants were 2,800+ square feet with 80-120 seats. In response to changing consumer behavior, the brand introduced three new prototypes: a 44-seat model, a 22-seat model, and Captain D’s Express, which features walk-up and drive-thru service with no indoor seating. This shift aligns with the increasing demand for mobile ordering and drive-thru convenience while also reducing construction and operational costs.
Leveraging Mobile Movement Data for Smarter Decision-Making
Traditionally, Captain D’s relied on in-person surveys to understand customer behavior. With Tango, they now use mobile movement data to analyze real customer foot traffic and travel patterns. This has provided a more precise understanding of trade areas and customer loyalty, enabling better decision-making in site selection.
Identifying Competitors and Market Opportunities
The brand also gained deeper insights into indirect competitors beyond seafood chains, such as chicken and hamburger QSRs. Through Tango’s analytics, Captain D’s identified key market attributes, including ideal co-tenants and demand generators. The data also highlighted population density requirements to ensure a sustainable level of demand, especially in markets with direct seafood competitors.
Targeting High-Opportunity Markets
Understanding trade areas and customer behaviors allowed Captain D’s to prioritize expansion in high-opportunity markets. By analyzing the “effective population score”— a metric combining population count and purchasing propensity — Captain D’s can pinpoint the most profitable local markets. These insights are critical for franchise sales teams to strategically target potential franchisees and investors.
Results & Future Outlook
Improved Site Selection: Tango’s predictive modeling ensures Captain D’s selects locations that maximize revenue potential while minimizing market cannibalization.
Better Customer Targeting: With clearer insights into customer travel behavior and demand patterns, the brand has enhanced its localized marketing efforts.
Scalable Growth Strategy: The combination of streamlined store prototypes and data-driven market selection positions Captain D’s for sustained, efficient expansion.
By leveraging Tango’s advanced analytics, Captain D’s has successfully modernized its real estate strategy, ensuring that its restaurants align with evolving consumer preferences while optimizing profitability. This partnership underscores the power of data in driving smarter business decisions and securing long-term growth in the competitive QSR landscape.
We know—it takes two to Tango
When you choose Tango, you get more than quality real estate tools. You get a team of experts in your corner. As pioneers in IWMS, SLM, GIS, and predictive analytics, we bring more than three centuries of cumulative experience to your organization’s goals and challenges.
Whatever your real estate strategy, we can help you refine, execute, and maximize it. Let’s find your real estate’s real value.