The larger your business’ real estate portfolio, the more valuable it is to understand which locations are performing as expected. Without this knowledge, you could be pouring resources into dead-end locations, renewing leases that ought to be restructured or terminated, and missing out on new opportunities that could be generating much more revenue.
But it isn’t as simple as looking at total revenue for each store and letting go of the underperformers. Many different elements affect the performance of a given site. You need to take into account how each store should be performing, considering the trade area, site characteristics, and local demographics.
While you could do this yourself with a tool like Tango Predictive Analytics, it can be a complicated and time-consuming process—especially if you aren’t used to doing it regularly.
That’s why we provide a portfolio review service at no additional cost for our Predictive Analytics customers. Using EBITDA or each store’s sales volumes, we analyze the expected performance for each location compared to your actual performance. We also work with you to create recommended action steps for each store. You’ll come away from the process with clear visualizations of your portfolio’s projected and actual profitability, empowering you to investigate anomalies and validate your location strategy.
Here’s what the process looks like.
How Tango’s portfolio review works
We start by working with you to gather information about the trade areas your stores operate in. We’ll ask a series of questions about your locations to assign each store a trade area score and site score, which we’ll use to assess their expected performance.
This includes demographics, competition, the size of the market, how long you’ve been operating in that market, and other relevant factors that affect the opportunity each trade area presents. These characteristics contribute to each location’s trade area score.
We also evaluate the qualities of each site, such as the size and layout of the building itself, along with ingress and egress, whether drivers are able to turn left to enter and exit, additional entrances from other roads, the availability of parking spaces, visibility, etc. This all contributes to how well a store is positioned to capitalize on the opportunity the trade area presents, and we use this information to calculate each location’s site score.
Once we’ve assigned each store a trade area score and a site score, we visualize your portfolio on a graph. We map the trade area quality index along the X axis and the site quality index along the Y axis, each from 0 to 100. Each of your locations represents a point on the graph, color-coded according to their earnings before interest, taxes, depreciation, and amortization (EBITDA). If you don’t have access to your portfolio’s EBITDA, we can use each store’s volume as well.
The graph is divided into four quadrants. The upper right-hand quadrant, which we refer to as “stars,” represents sites with the greatest potential based on their site characteristics and trade area characteristics. We would expect these to be high-performing locations.
In the lower left quadrant, you’ll find poor-quality sites in poor trade areas—these are the “dogs.” These could be in areas with a small population or heavily influenced by competition, and they could be locations with poor visibility or difficult access, etc. Whatever the specific reasons, these are the sites we would expect to be on the lower end of EBITDA.
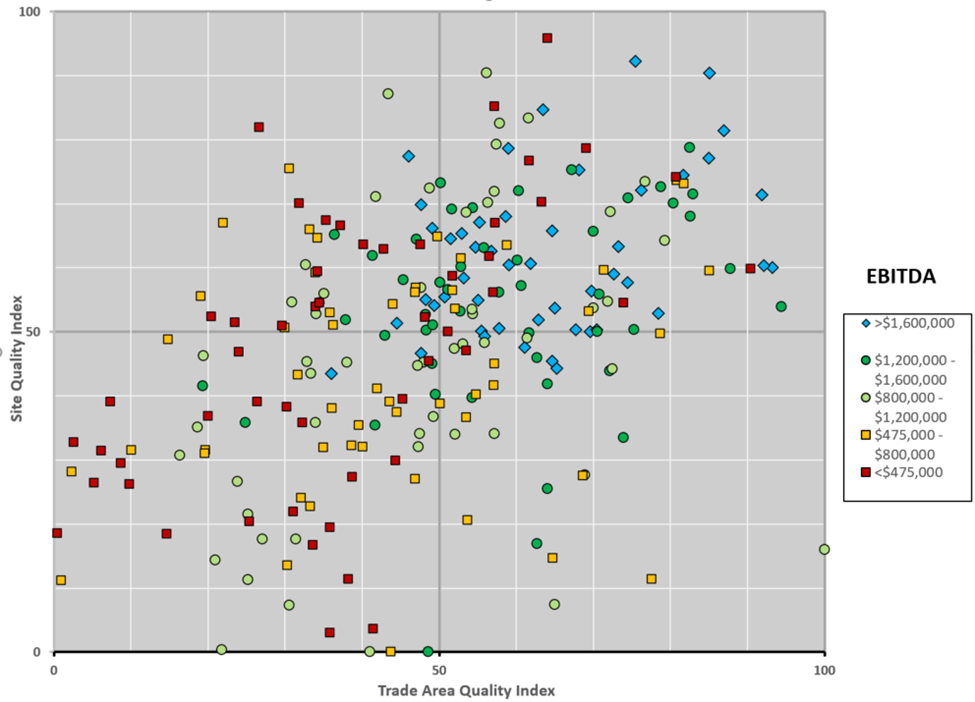
As you can see in the example above, more sites than not line up as we might expect. The blue high-performing sites are mostly in the upper right quadrant, and the red poor-performing sites are mostly in the lower left quadrant. But there are also plenty of exceptions. And those exceptions tell us something important about those locations. That’s what we’ll consider next.
What a portfolio review can do for your business
Our portfolio review provides you with a big-picture overview of your locations, letting you see at a glance which stores are performing as expected and where the major anomalies are. While each of these anomalies is worth investigating, most businesses focus on the red stores in the “star” quadrant—the locations that should be your top performers but rank among your worst.
Take a closer look at underperforming sites
Red locations in the “star” quadrant are underperforming despite having every advantage on paper, and you need to find out why. Is the rent too high in this location? Should they renegotiate their lease? Do they have a poor-performing store manager? Bad reviews? Too many big changes recently? Whatever the reason, these sites should be doing much better than they are, so you need to find the problem and fix it.
See what good locations need to stay on track
A green to blue site is good to see, no matter where it lands. But which quadrant these locations fall under helps you understand what conditions could cause them to fall behind.
A top-performing store in the “outpost” quadrant could be vulnerable to changes in the trade area that affect visibility, accessibility, or traffic flow, which negatively impact its site characteristics. A top-performing store in the “flawed” quadrant could be vulnerable to changes in local demographics and may be a good candidate for relocation. In either of these situations, a competitor could be extremely disruptive. It may be worth restructuring these leases and preparing an exit strategy. You can even use the results of our portfolio review as leverage with your landlord, showing them their site in relation to your best locations.
When green and blue stores fall within the upper right quadrant, it tells you they’re on track and in line with expectations. They’re performing as the model predicted, and you should most likely renew those leases.
Identify sites that go above and beyond expectations
When a store performs well despite being located in a poor trade area or site (or both), you have reason to take a closer look and ask why.
Is it due to a manager or other employees who are doing exceptional work despite the location (and do they deserve a promotion or raise)? Is this store doing something different you could replicate in other locations? Or is it in a trade area of high enough quality to make up for the poor quality of the site itself—and if so, could you do even better by moving to a different site in that same trade area?
As with your stores that fit the performance model, you’ll want to consider which of these overperformers are most vulnerable and have a plan in place for if conditions change.
Prioritize which stores to close
Finally, it’s time to take seriously the poor-performing sites in the lower left quadrant. They’re in a poor-quality trade area, in a poor-quality site, and they aren’t making much money. Given all the factors stacked against them, it’s unlikely they’ll ever be able to turn things around.
For these locations, you need to seriously consider whether it’s worth keeping them open. When it comes time to renew these leases, it might be best to opt-out or, at the very least, negotiate for lower rates. (Your portfolio review results may be able to make a compelling case for lowering rent or getting more favorable terms, perhaps even a remodel budget that would improve the site score.)
Part of the review process involves more nuanced conversation about your portfolio, helping you build a list of action items that best fits with your business goals and portfolio’s performance.
Gain location-based insights with Tango Predictive Analytics
Portfolio reviews are just one of the many benefits we provide to our Predictive Analytics customers. It helps demonstrate the reliability of our sales forecasting and site modeling capabilities while helping you refine the process to fit your unique portfolio. And whether you’re considering closures, evaluating possible relocations, or just taking stock of your real estate portfolio, you’ll need insights into the trade areas in which you operate.
Tango Predictive Analytics uses advanced GIS tools and datasets to help you visualize and analyze markets. Tango Predictive Analytics creates stunningly accurate sales forecasts by combining our data, your custom site selection criteria, and machine learning—empowering you to more reliably compare opportunities. With our decades of retail location modeling experience, you’ll be equipped to develop smart location strategies and make the best real estate decisions.
See what our predictive analytics software can do for your organization.