In my previous blog, Demographics in International Markets: Challenges and Opportunities, I examined the first of two important factors that affect the quality of demographics in international markets, the geographic unit. Another important factor in GIS analysis of retail analytics is the demographic variable. When sourcing demographic data, the first question all retailers ask is “how big is the geographic unit?” followed quickly by the second question “what variables are included in the data?”.
Let’s delve a bit deeper into the demographic variable.
What is a demographic variable?
Population Count
The most basic variable in demographics is population count, and it’s included in every dataset. From a retailer’s perspective, this is a foundational variable that they require to conduct any analysis.
For retail concepts that target all ages and income levels, overall population is the key determinant to the success of a location. From Walmart to 7-Eleven to KFC, analysts want to know how many people are in the store’s trade area and whether that population can support the store. Retailers will set a certain threshold, and if the targeted location doesn’t meet it, the location will not be selected.
In addition to understanding population counts to determine the success of a particular location, it’s also important to be able to see into the future and determine if the population will be able to continue to sustain that location. In the US, several companies use sophisticated methods, like cellular automation (CA), which utilizes the growth of the road network to predict population growth. In emerging markets, there are alternative techniques, including leveraging aerial and satellite imagery as well as crowd-sourced datasets to both estimate population growth, as well as trends in the expansion of the urban sprawl. In fact, Tango Analytics used some of these techniques them for a global QSR chain who was looking at locations in several countries in Latin America and Asia, and was able to help them get the results they required.
Night-time satellite imagery, as provided by the Defense Meteorological Satellite Program (DMSP), also shows promise as a proxy measurement of urban extent. Efforts have shown that the areas of contiguous saturated DMSP OLS images show strong correlations with the total population living in those areas. Lighter pixels represent more population and more active human activities. We can use time series data to predict the population growth. Here is an example of Wuhan, China.

Population Age
Age breaks or bands are also widely available in the dataset, and are an essential component of retail analytics for certain concepts. To a retail concept like Toys R Us, people with children who are younger than 16 years old are target customers. If the dataset contains this age group, it will be very helpful to them when running the trade area population profile for a particular location.
Some countries are better than others at providing very detailed age breakdowns. For example, Ecuador provides data at a one year break level, and we often have to group them to get the right dataset. More commonly, countries provide age information at a 10 year break, which provides sufficient granularity to run the analysis. Some countries, unfortunately, only group them in broader categories – such as young/adult/senior – making it quite difficult to get accurate results.
There are several ways to improve the accuracy of age data. For example, by using e-commerce data of purchases – i.e. for products related to babies – we can easily tell which block or parcel has more households with babies at home, and therefore can model the age data more precisely.
Income and Socio-economic Class
Income and socio-economic class are also desired variables by retailers’ analysts, but are usually not available from census data. In many developed countries, this data may be available in the dataset, though they may present themselves in a different way since they are not provided directly from the census department.
In the UK, socio-economic data can be found in their Living Cost and Food (LCF) survey, where one of the points of data they track is disposable weekly income. In the US, this data is mostly from the American Community Survey, and is calculated as annual household income. Some countries including South Korea, source their income data from a third party company, which determines the data by extrapolating from credit information and government income data.
If the income data is not available at all, analysts look for socio- economic class information, which can be found in many developed countries. For example, Mexico National Institute of Statistics and Geography (INEGI) provides Niveles Socioeconomicos (NSE) categories (A/B, C+, C, D+. D, E), which classify the population based on relative income and living standard, and which is sometimes more helpful than raw income data.
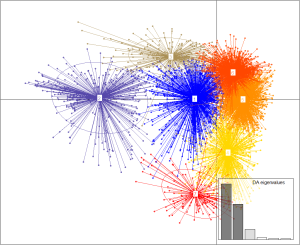
 Some countries don’t have socio-economic class data, but have access to variables related to housing conditions that indicate income levels, such as number of internet users, cell phones, flat-screen TVs and refrigerators. They also have education level and occupation information, and combining this information, we can establish socio-economic class using various models, including K-Means and Discriminant Analysis of Principal Components. Here is an example of what Tango has done in Chile. Based on the answer to the census survey related to ownership of cars, van and washing machines, etc. we can successfully classify 7 different classes.

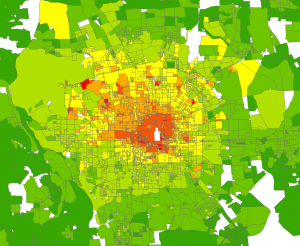
Some countries don’t release this kind of information, and we have to come up with something unique to represent income and social class. For example, In China, Tango uses housing prices to model income distribution of Beijing.
Time of Day
Daytime population is essential to many retailers who rely on a work-day traffic. The challenge is that dataset is separate from the normal census survey, and is very difficult to obtain. In order to get around this issue, data from hotels as well as business Points of Interest (POIs) will often help retailers get a better handle on daytime population.
There is also now a more accurate way for retailers to get data on day-time traffic – and in fact, Tango recently announced a partnership with UberMedia, a leading independent developer of mobile applications and mobile advertising solutions. When integrated with Tango Analytics’ solution, UberMedia’s mobile data points under its UberRetail brand, provide retailers with actionable customer information to align their real estate strategies with changing customer dynamics. Combining UberMedia’s raw mobile data points with Tango Analytics’ sophisticated predictive analytics capabilities, retailers are able to tell where their customer frequented immediately before or after a visit to a particular store location. Depending on the time of day, this information will help retailers understand where their customers work and live.
This partnership represents the first time this type of analysis can be done with mobile data on a national scale and also represents a total game changer in the area of location and customer analytics.
________
Demographic variables – combined with information about the Geographic Unit – provide retailers with the necessary information required to compare and evaluate new locations within markets. And while this type of data is readily available in the US, as you’ve read in my two blog posts on this topic, this is not always the case in other markets. From our experience with over 50 brands across 6 continents, Tango has come to learn a great deal about the best methods to source this data, guarantee its quality through the use of state-of-the-art technology – and then ensure its successful application in support of our customers’ international growth plans.
If you would like to learn more about how to access the most current and accurate information, download Tango’s datasheet below.
